Node Monitoring
In this chapter we will walk you through the setup of local monitoring for your validator node.
Prerequisites
You must have your collator node up and running.
This guide was tested on Ubuntu 20.04 LTS release.
Prometheus Setup
In the first step we will set up the Prometheus server.
User and Directories
We create a user just for monitoring purposes which has no home directory and can't be used to log in.
$ sudo useradd --no-create-home --shell /usr/sbin/nologin prometheus
Then we create directories for the executable and the configuration file.
$ sudo mkdir /etc/prometheus
$ sudo mkdir /var/lib/prometheus
Change ownership of the directories to restrict them to our new monitoring user.
$ sudo chown -R prometheus:prometheus /etc/prometheus
$ sudo chown -R prometheus:prometheus /var/lib/prometheus
Install Prometheus
Check latest version number of Prometheus at the GitHub release page.
At the time of writing it is v2.34.0. Insert the latest release version in the following commands.
# download prometheus
$ wget https://github.com/prometheus/prometheus/releases/download/v2.34.0/prometheus-2.34.0.linux-amd64.tar.gz

# unpack the binaries
$ tar xfz prometheus-*.tar.gz

# enter the unpacked directory
$ cd prometheus-2.34.0.linux-amd64
Now copy over the binaries into the local folder.
$ sudo cp ./prometheus /usr/local/bin/
$ sudo cp ./promtool /usr/local/bin/
We now need to assign those binaries to our freshly created user.
$ sudo chown prometheus:prometheus /usr/local/bin/prometheus
$ sudo chown prometheus:prometheus /usr/local/bin/promtool
Next up we'll copy the web interface and the configuration presets.
$ sudo cp -r ./consoles /etc/prometheus
$ sudo cp -r ./console_libraries /etc/prometheus
You may have guessed it already but we're also changing the ownership of those directories.
$ sudo chown -R prometheus:prometheus /etc/prometheus/consoles
$ sudo chown -R prometheus:prometheus /etc/prometheus/console_libraries
We now have everything we need from the downloaded package so we will go one step back and do some cleanup.
$ cd .. && rm -rf prometheus*
Let's create a YAML configuration file for Prometheus with the editor of your choice (nano / vim / pico).
$ sudo nano /etc/prometheus/prometheus.yml
Our config is divided in three sections:
global: sets the default values forscrape_intervaland the rule-execution interval withevaluation_intervalrule_files: specify rule-files the Prometheus server should loadscrape_configs: this is where you set the monitoring-resources
We will keep it very basic and end up with something like this:
global:
  scrape_interval: 15s
  evaluation_interval: 15s

rule_files:
  # - "weHaveNo.rules"

scrape_configs:
  - job_name: "prometheus"
    scrape_interval: 5s
    static_configs:
      - targets: ["localhost:9090"]
  - job_name: "substrate_node"
    scrape_interval: 5s
    static_configs:
      - targets: ["localhost:9615"]
The first scrape job exports data of Prometheus itself, the second one exports the HydraDX node metrics.
We adjusted the scrape_interval of both jobs to get more detailed statistics. This overrides the global values.
The target in static_configs sets where the exporters run, we stick to the default ports here.
After saving the configuration we will - once again - change the ownership.
$ sudo chown prometheus:prometheus /etc/prometheus/prometheus.yml
Starting Prometheus
To have Prometheus starting automatically and running in the background we'll use systemd.
Create a new config (again with the editor of your choice):
$ sudo nano /etc/systemd/system/prometheus.service
Paste the following configuration and save the file.
[Unit]
  Description=Prometheus Monitoring
  Wants=network-online.target
  After=network-online.target

[Service]
  User=prometheus
  Group=prometheus
  Type=simple
  ExecStart=/usr/local/bin/prometheus \
  --config.file /etc/prometheus/prometheus.yml \
  --storage.tsdb.path /var/lib/prometheus/ \
  --web.console.templates=/etc/prometheus/consoles \
  --web.console.libraries=/etc/prometheus/console_libraries
  ExecReload=/bin/kill -HUP $MAINPID

[Install]
  WantedBy=multi-user.target
Next we will perform the following three steps:
systemctl deamon-reload loads new configurations and updates existing
systemctl enable activates our new service
systemctl start triggers the execution of the service
You can perform the steps above in one command by executing:
$ sudo systemctl daemon-reload && systemctl enable prometheus && systemctl start prometheus
You should now be able to access Prometheus' web interface at http://localhost:9090/.
Node Exporter
We will install Node Exporter to scrape server metrics that will be used in the dashboard.
Please check the version number of the latest release here and update the command.
At the time of writing the latest version was 1.3.1.
Install Node Exporter
Download the latest release.
$ wget https://github.com/prometheus/node_exporter/releases/download/v1.3.1/node_exporter-1.3.1.linux-amd64.tar.gz
Unpack the archive you just downloaded. This will create a folder called node_exporter-1.3.1.linux-amd64.
$ tar xvf node_exporter-1.3.1.linux-amd64.tar.gz
Next we copy the binary into our local application directory and assign it to our monitoring user.
# copy binary
$ sudo cp node_exporter-1.3.1.linux-amd64/node_exporter /usr/local/bin

# set ownership
$ sudo chown prometheus:prometheus /usr/local/bin/node_exporter
We can now do some cleanup and remove the downloaded and unpacked package.
$ rm -rf node_exporter*
Create a Systemd Service
Similar to prometheus we want Node Exporter to run as a service too.
Create a systemd service with your editor of choice.
$ sudo nano /etc/systemd/system/node_exporter.service
And paste the following configuration into it.
[Unit]
Description=Node Exporter
Wants=network-online.target
After=network-online.target

[Service]
User=prometheus
Group=prometheus
Type=simple
ExecStart=/usr/local/bin/node_exporter

[Install]
WantedBy=multi-user.target
We will now activate and start the service with this one-liner.
$ sudo systemctl daemon-reload && systemctl enable node_exporter && systemctl start node_exporter
Add Scrape Job for Node Exporter
The Node Exporter is now up and running but we need to tell Prometheus to scrape its data.
We will open the configuration file once again with the editor of choice.
$ sudo nano /etc/prometheus/prometheus.yml
And at the very bottom of the file we will append one more scrape config.
Paste the following content and save the file.
  - job_name: 'node_exporter'
    scrape_interval: 5s
    static_configs:
      - targets: ['localhost:9100']
Then apply the changes. A restart of the Prometheus service is required.
$ sudo systemctl restart prometheus.service
Your server metrics are now scraped and can be found in the Prometheus web interface.
We will need them later for our dashboard.
Grafana Setup
We can see our metrics in the web interface, but that's not how we want to monitor it.
We want it nice and beautiful. That's where Grafana comes into play.
Install Grafana
Please check what's the latest Grafana Version with this link.
You can either change the version number in the following commands or copy the install commands directly from the link.
At the time of writing the latest version was 8.4.6.
$ sudo apt-get install -y adduser libfontconfig1
$ wget https://dl.grafana.com/oss/release/grafana_8.4.6_amd64.deb
$ sudo dpkg -i grafana_8.4.6_amd64.deb
The package comes with a builtin systemd-service which we will configure and start just like the Prometheus service.
$ sudo systemctl daemon-reload && sudo systemctl enable grafana-server && sudo systemctl start grafana-server
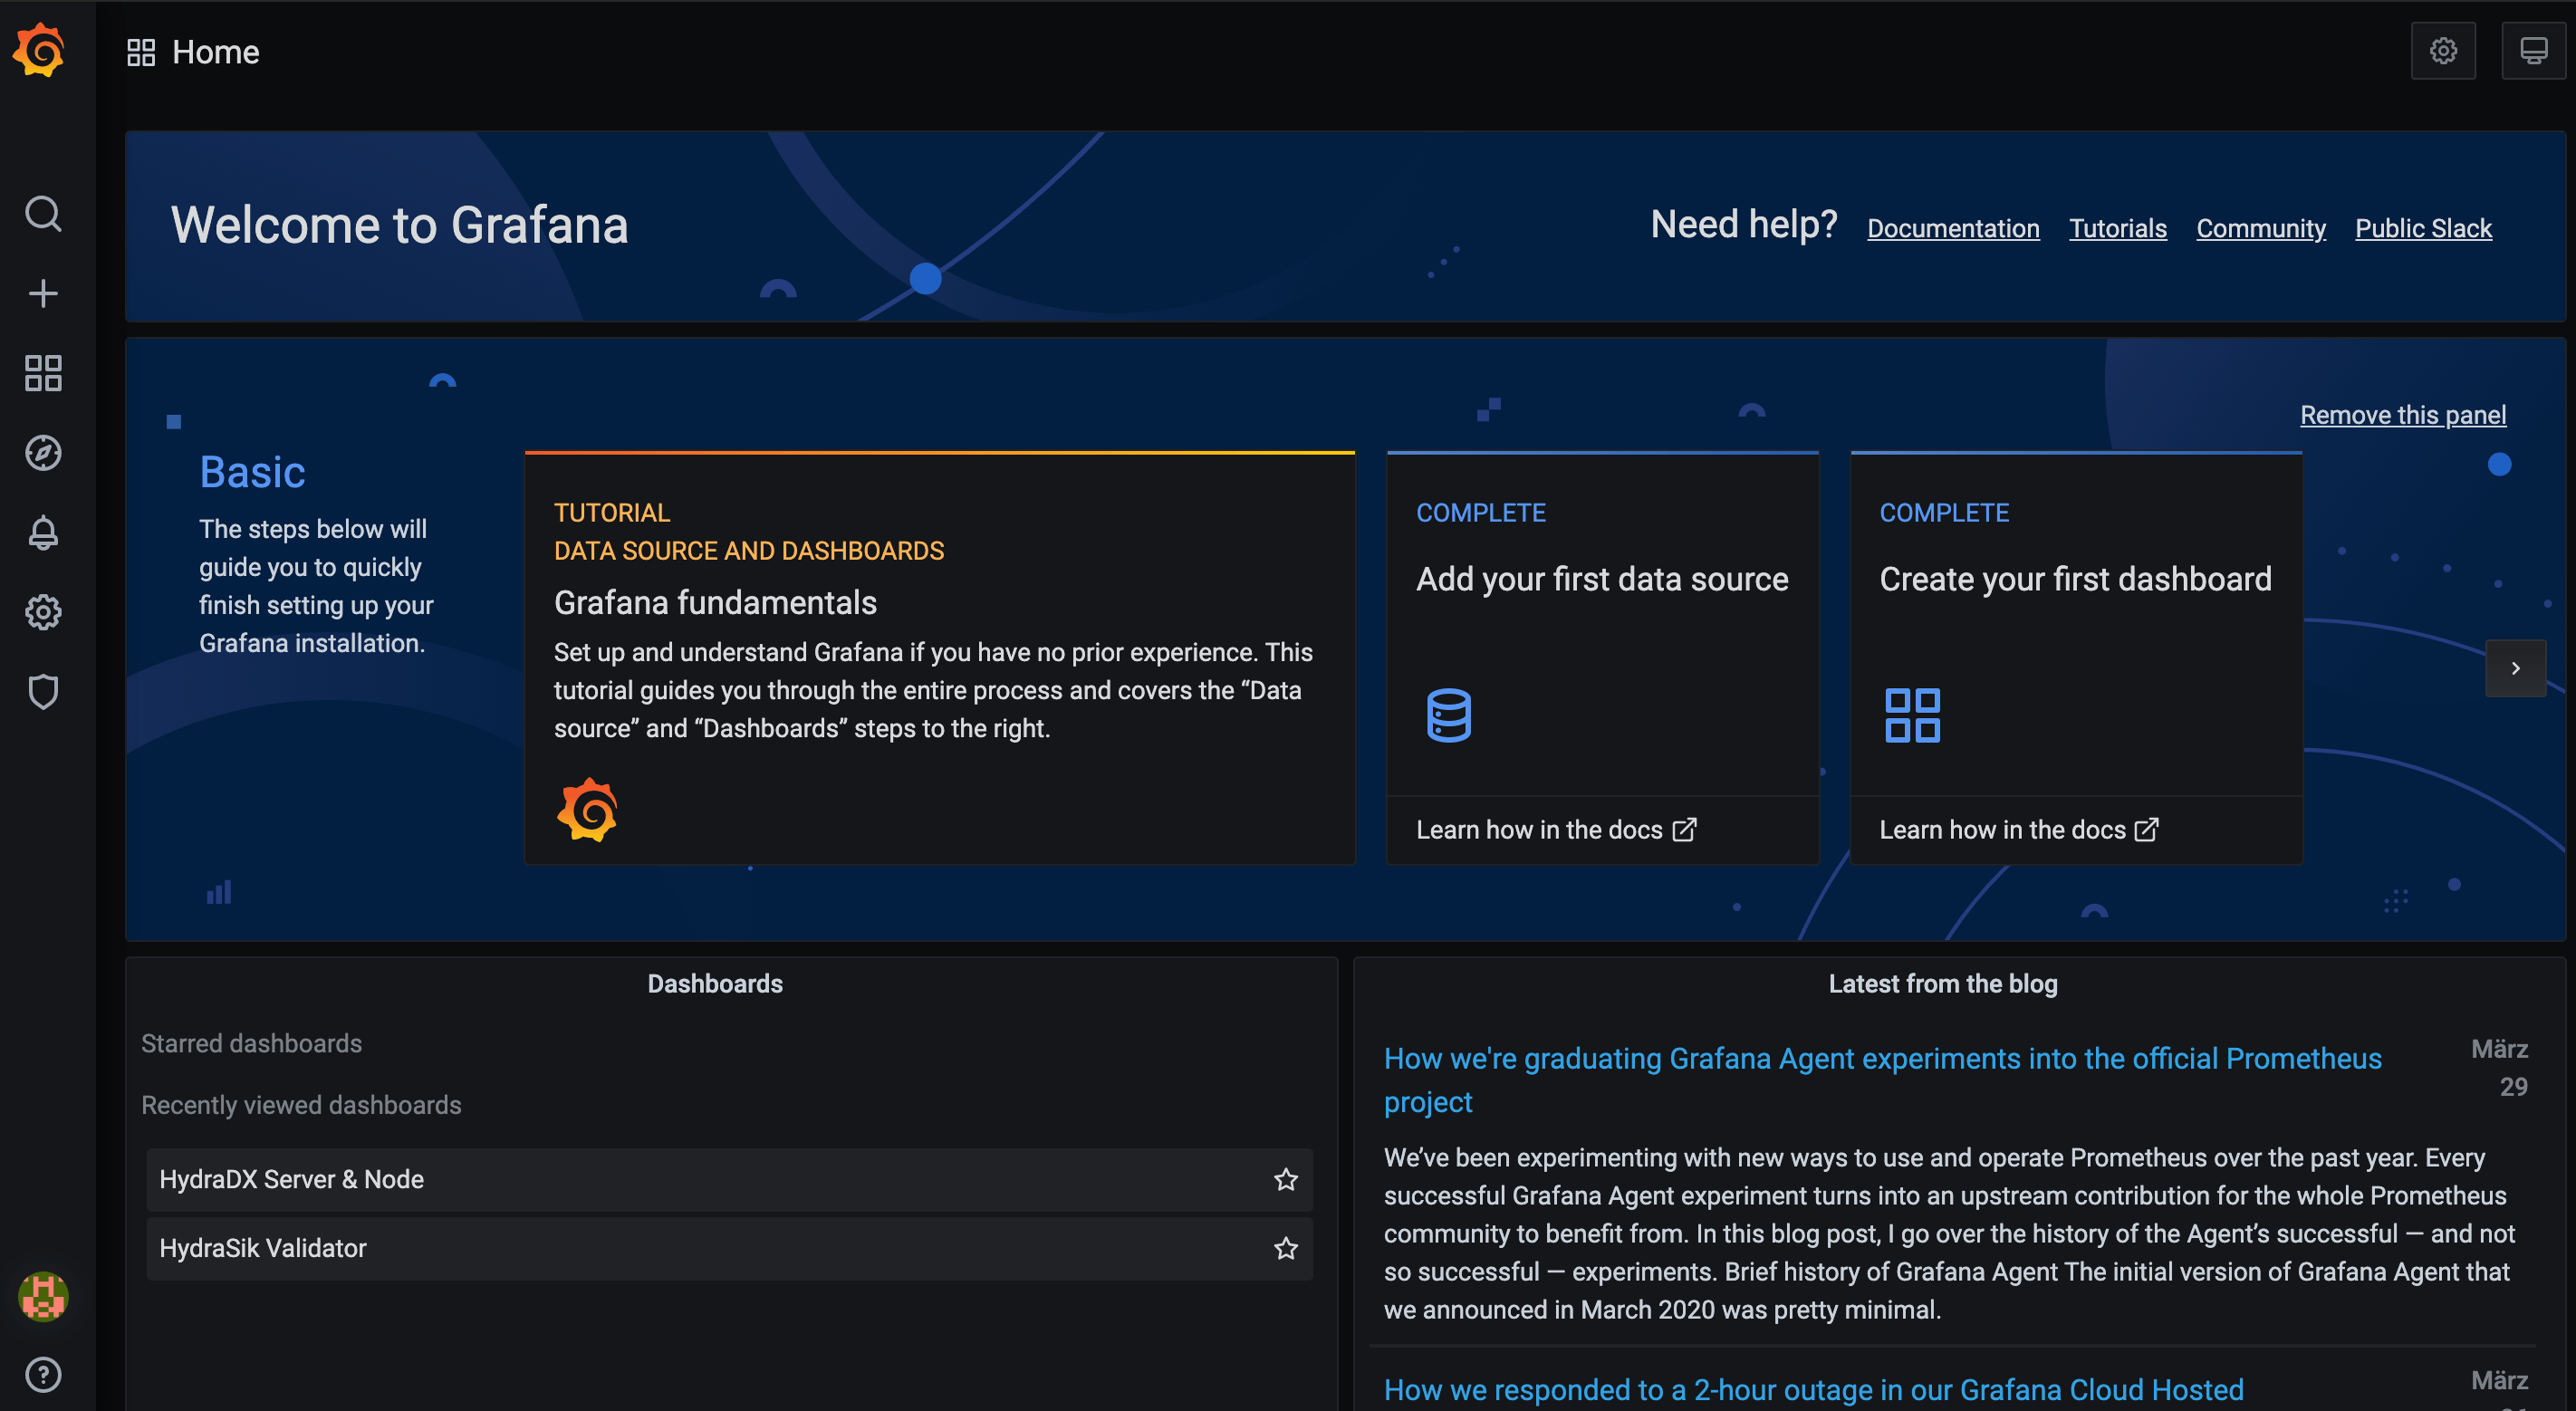
Accessing the Web Interface
We'll be able to open the Grafana web interface at http://localhost:3000/.
The default login Grafana is:
User: admin
Password: admin
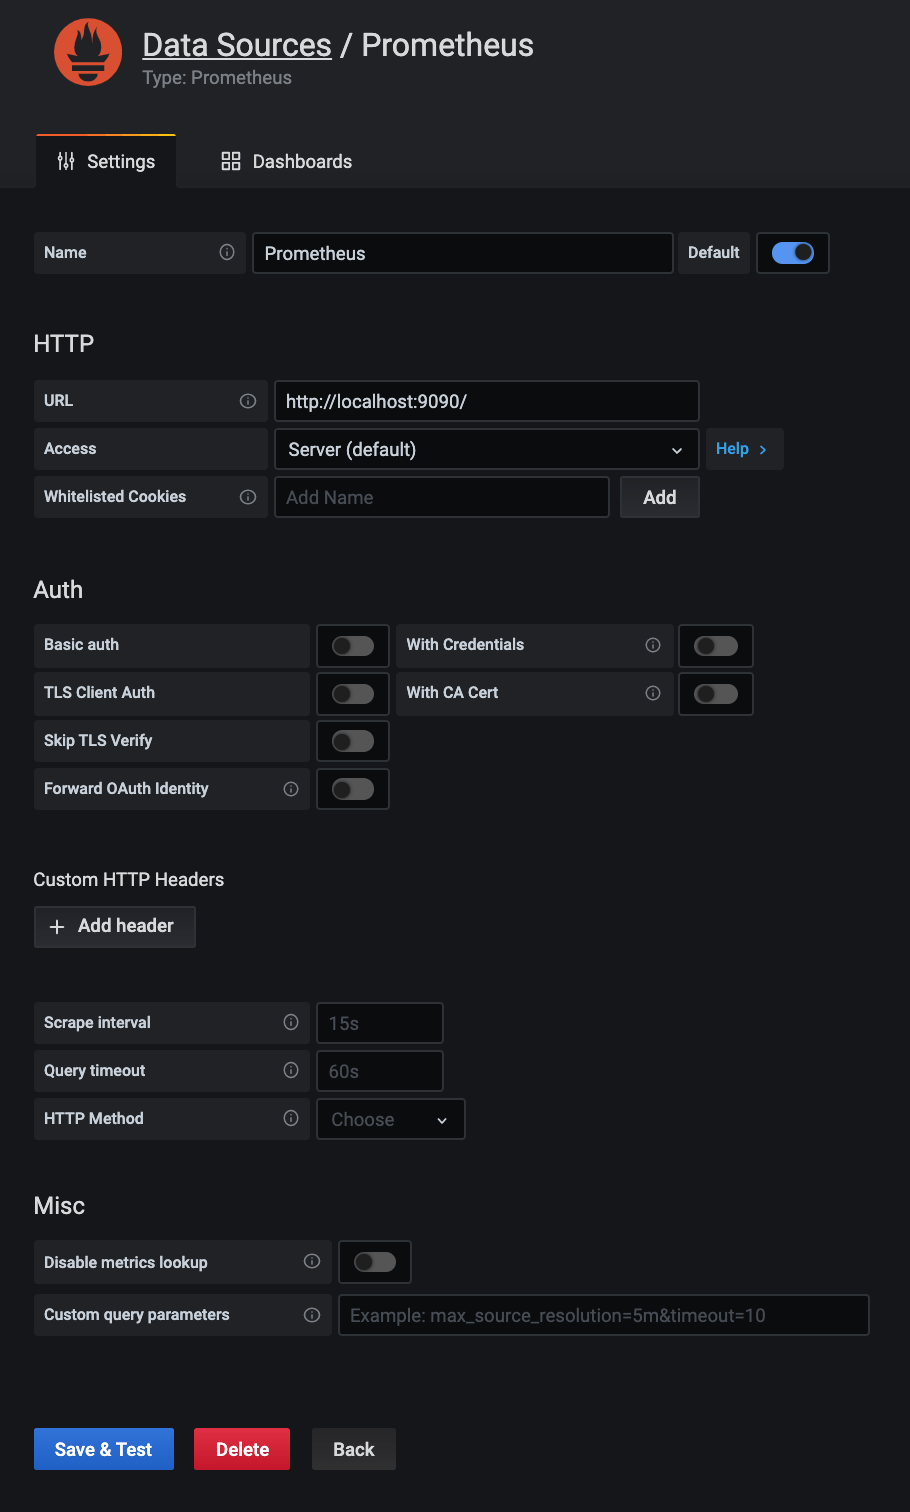
Configuring the Datasource
Please click the settings gear in the menu and select datasources.
In the next window you click "Add Datasource" and select "Prometheus".
In the following form you don't need to change anything but the URL.
Set http://localhost:9090/ and click Save and Test.
Importing the Dashboard
Please click the Plus-button in the main navigation and select import.
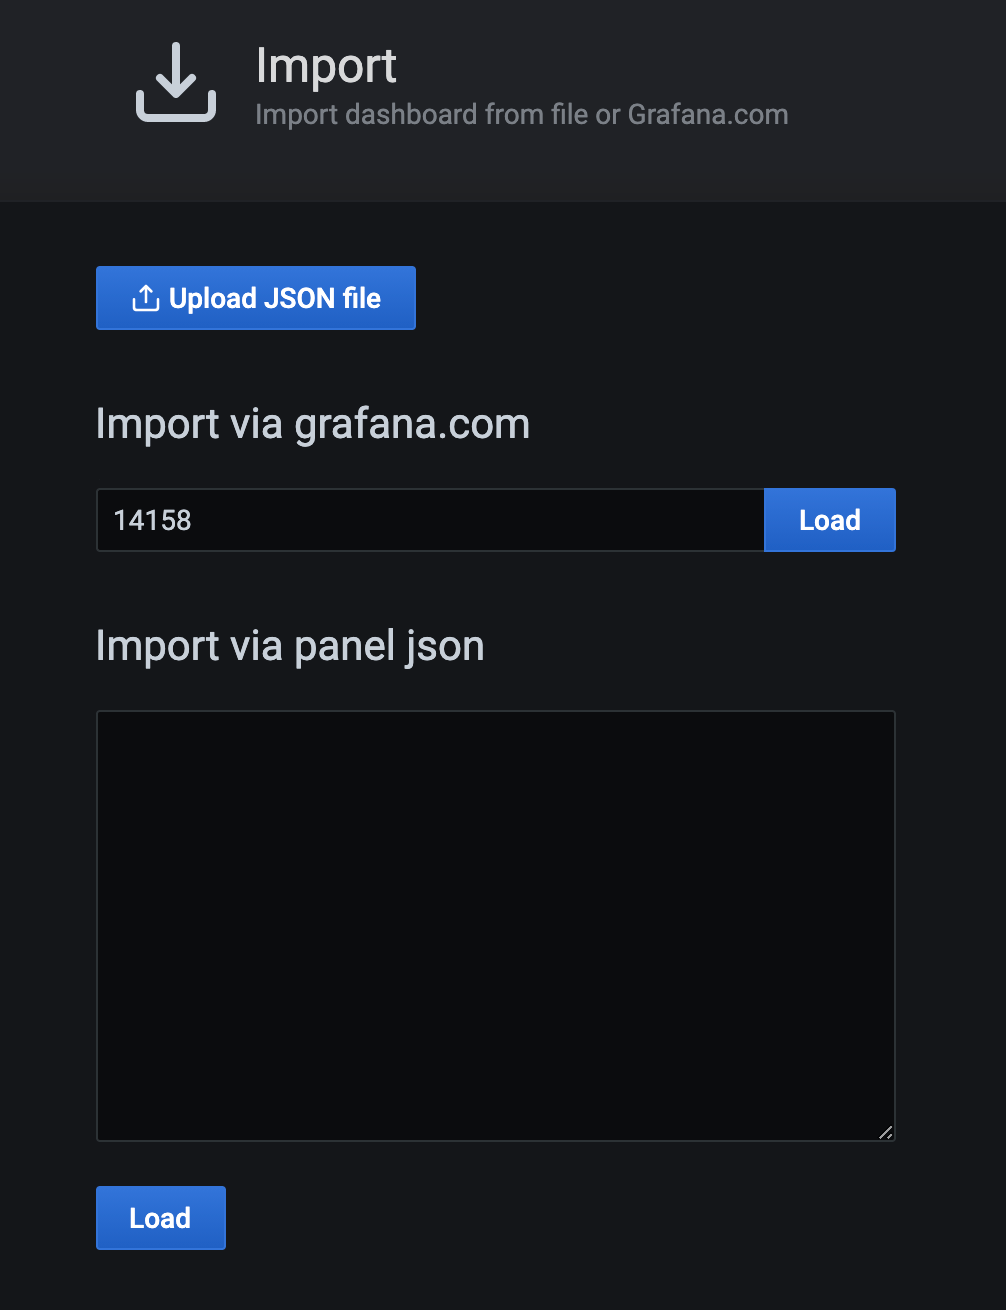
We will use the HydraDX Dashboard layout, so simply input the id 14158 and hit the Load-button.
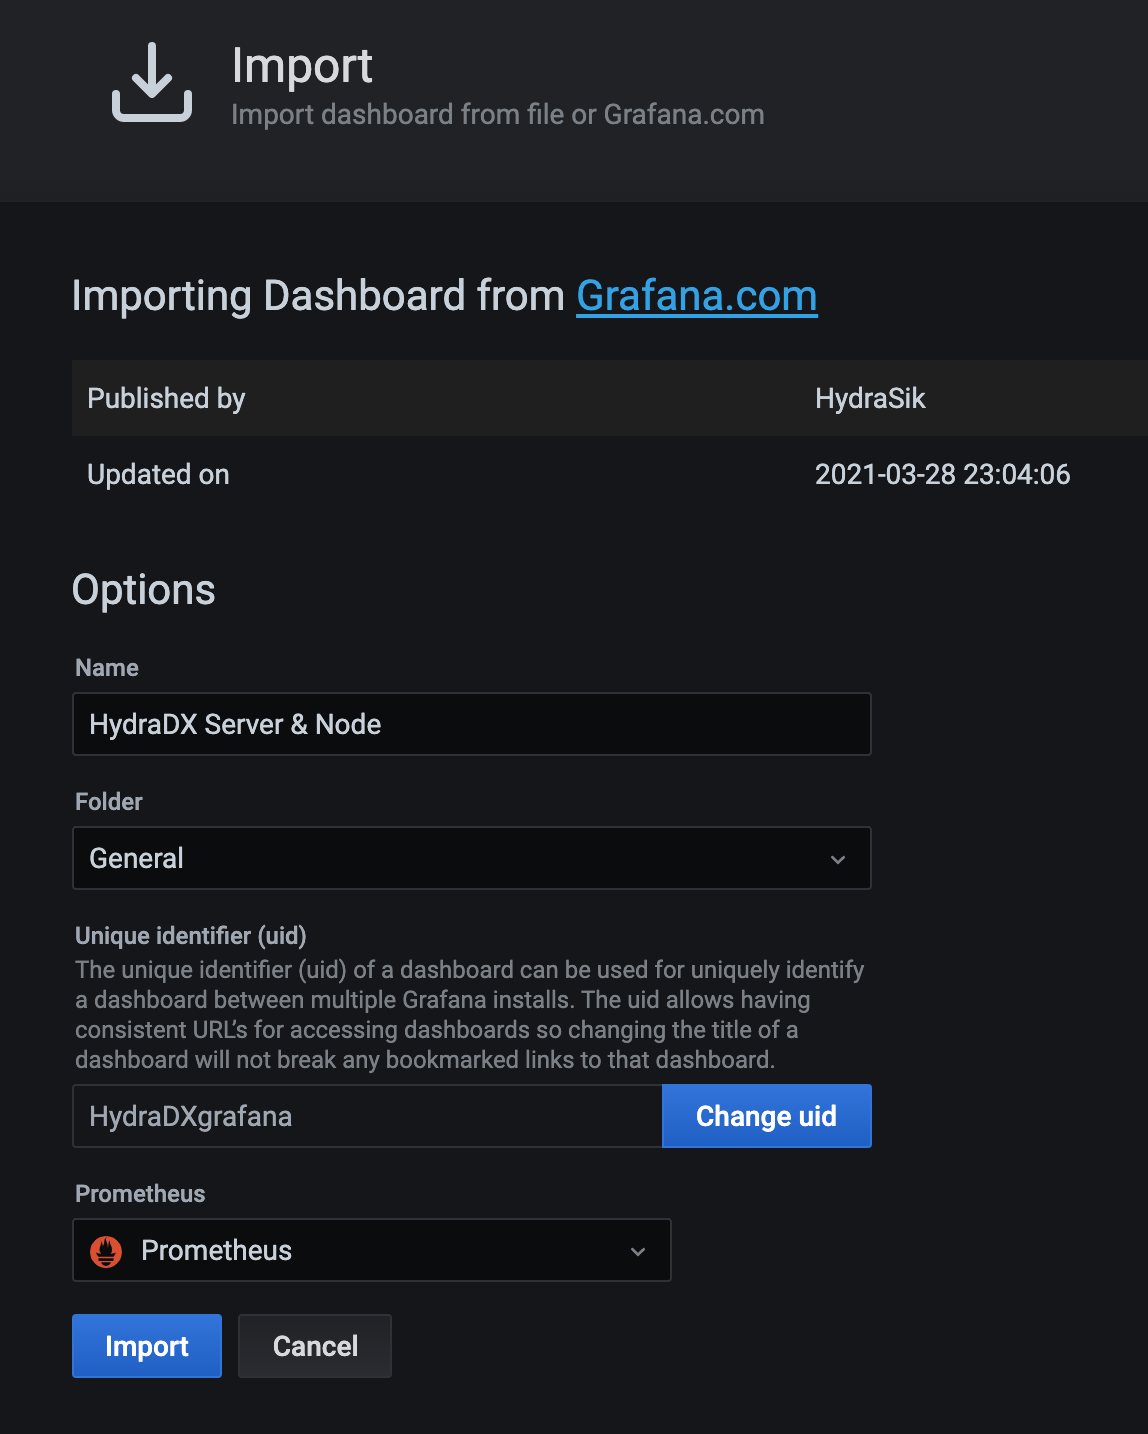
You don't need much configuration here, just make sure Prometheus is used as the datasource.
You can now finish the import.
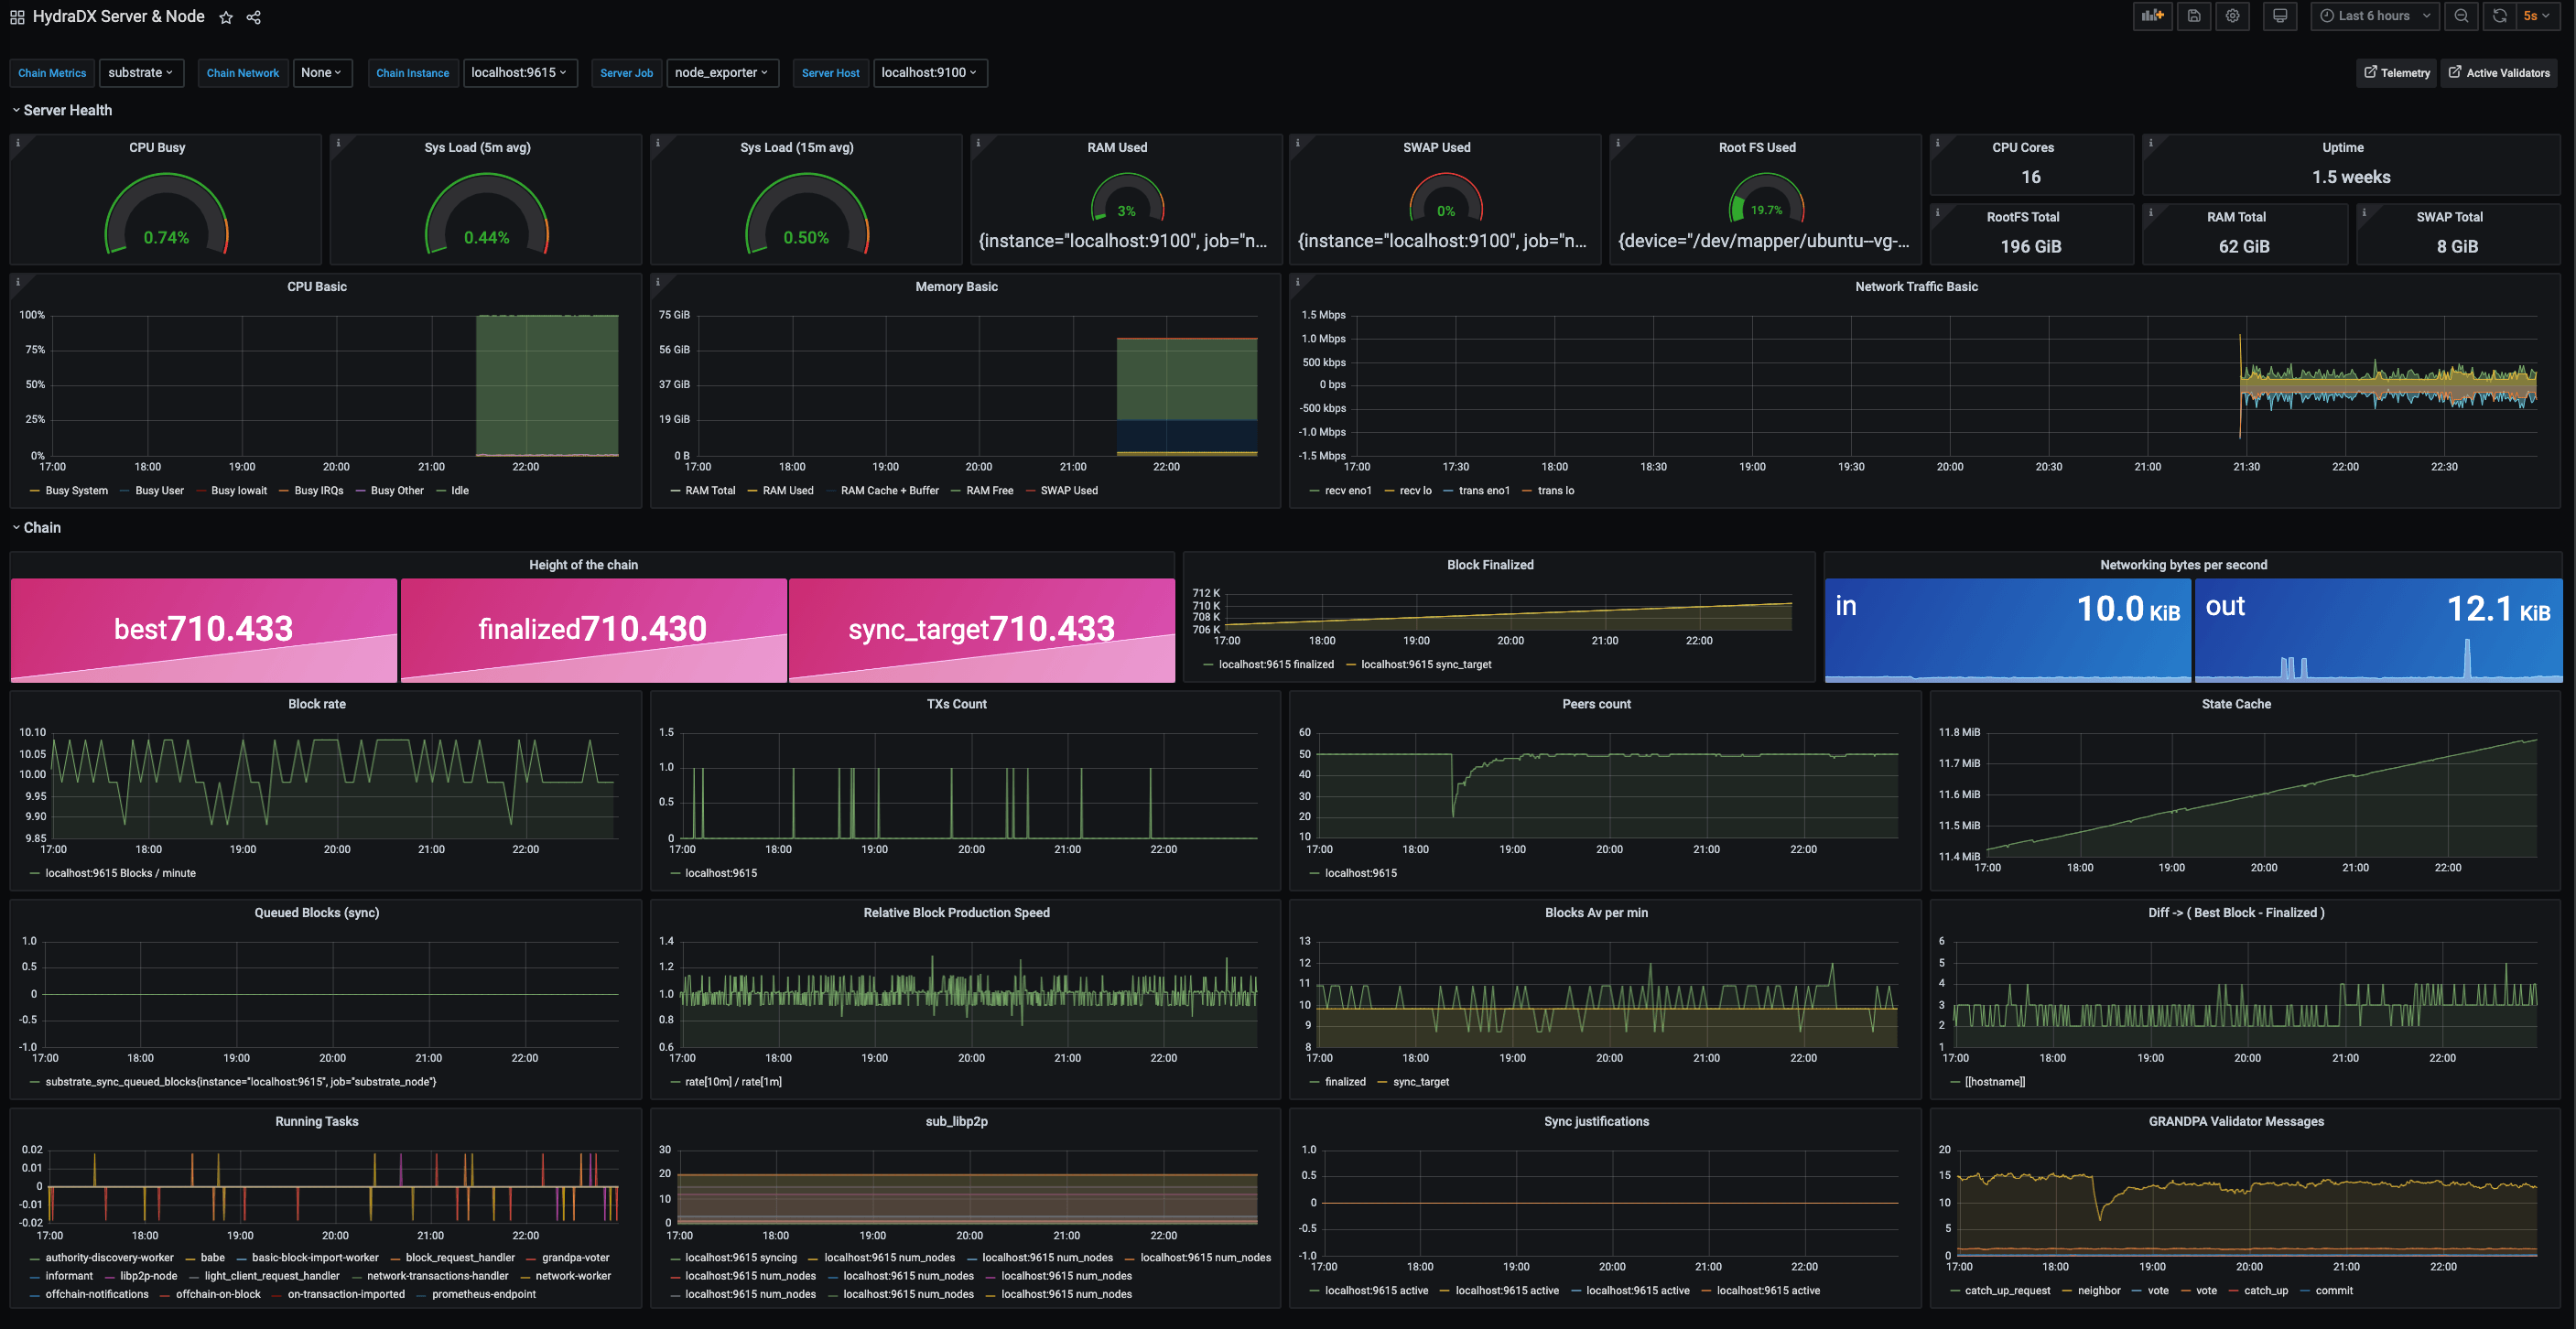
You should now see your dashboard right away.
If some panels are empty please ensure your selection above the panels is like this:
Chain Metrics: SubstrateChain Instance: localhost:9615Server Job: node_exporterServer Host: localhost:9100